02 / DATA / 2026
FINANCIAL
TRACKER
Spreadsheet for monthly tracking of income and expenses.
ORGANIZED MONTHLY TRACKING
Financial tracker built to centralize records and monitor each month's transactions within a single spreadsheet.
A PRACTICAL NEED
The project came from the need to organize the financial activity of a small rural operation, making it easier to record expenses and understand each month's results.
- Centralize income, expenses, and fixed costs in a single file.
- Make monthly data entry easier without relying on external systems.
- Provide quick access to balances and spending distribution.
ONE MONTH PER TAB
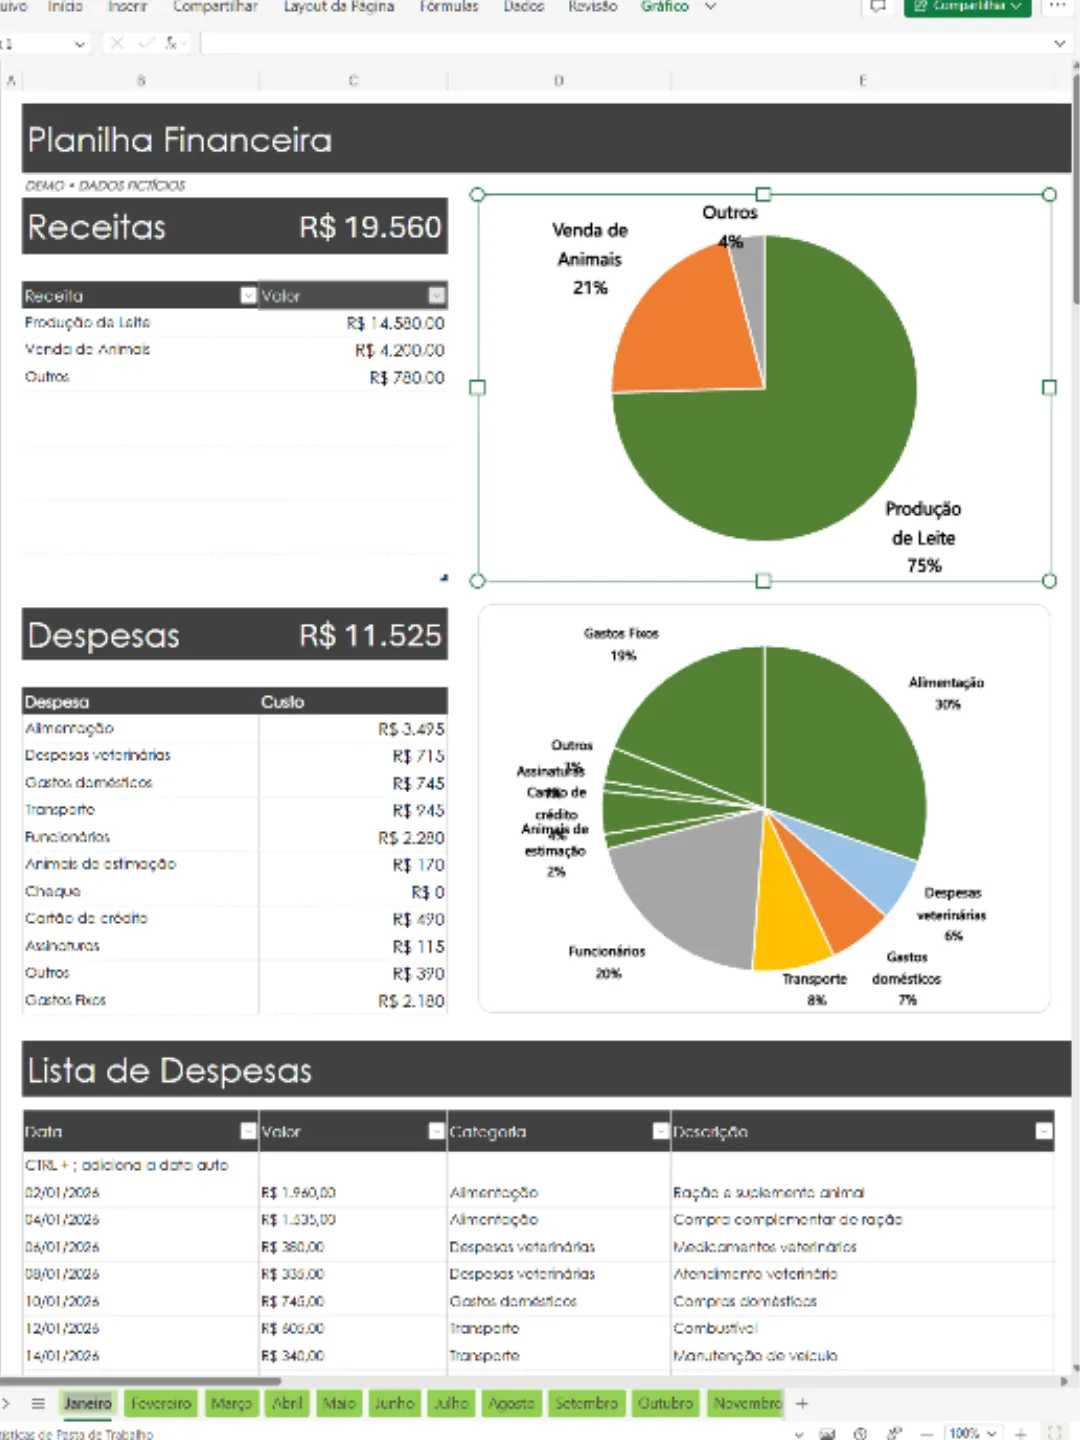
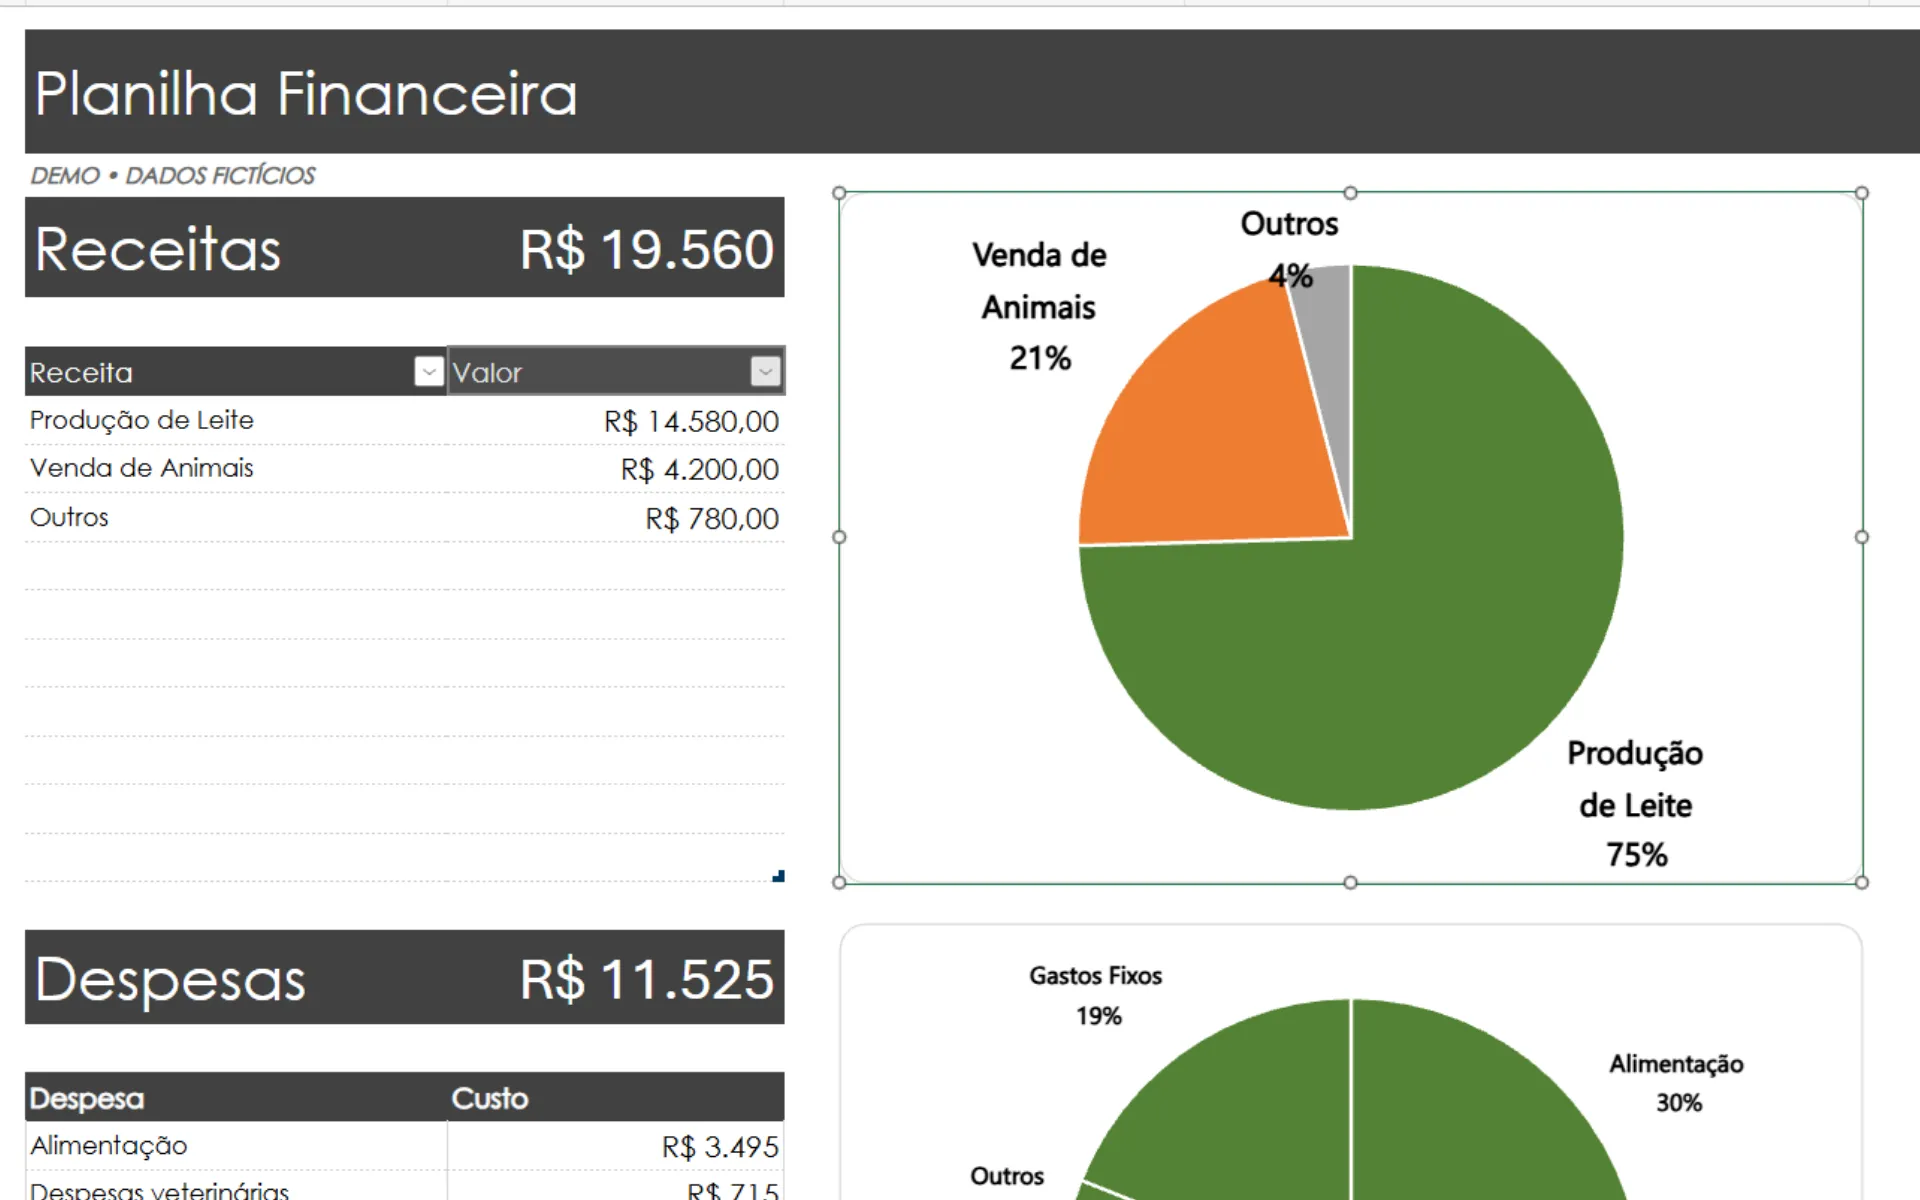
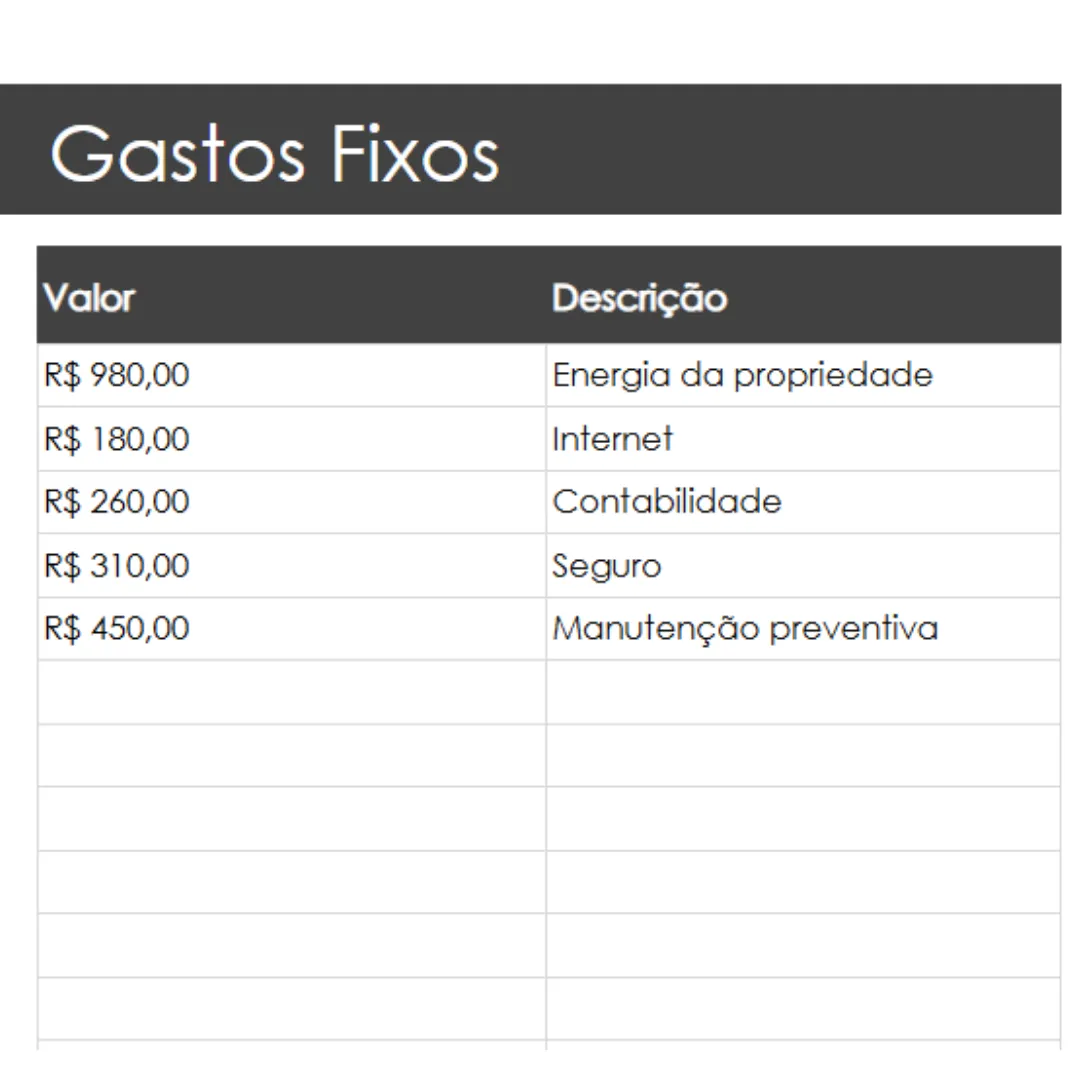
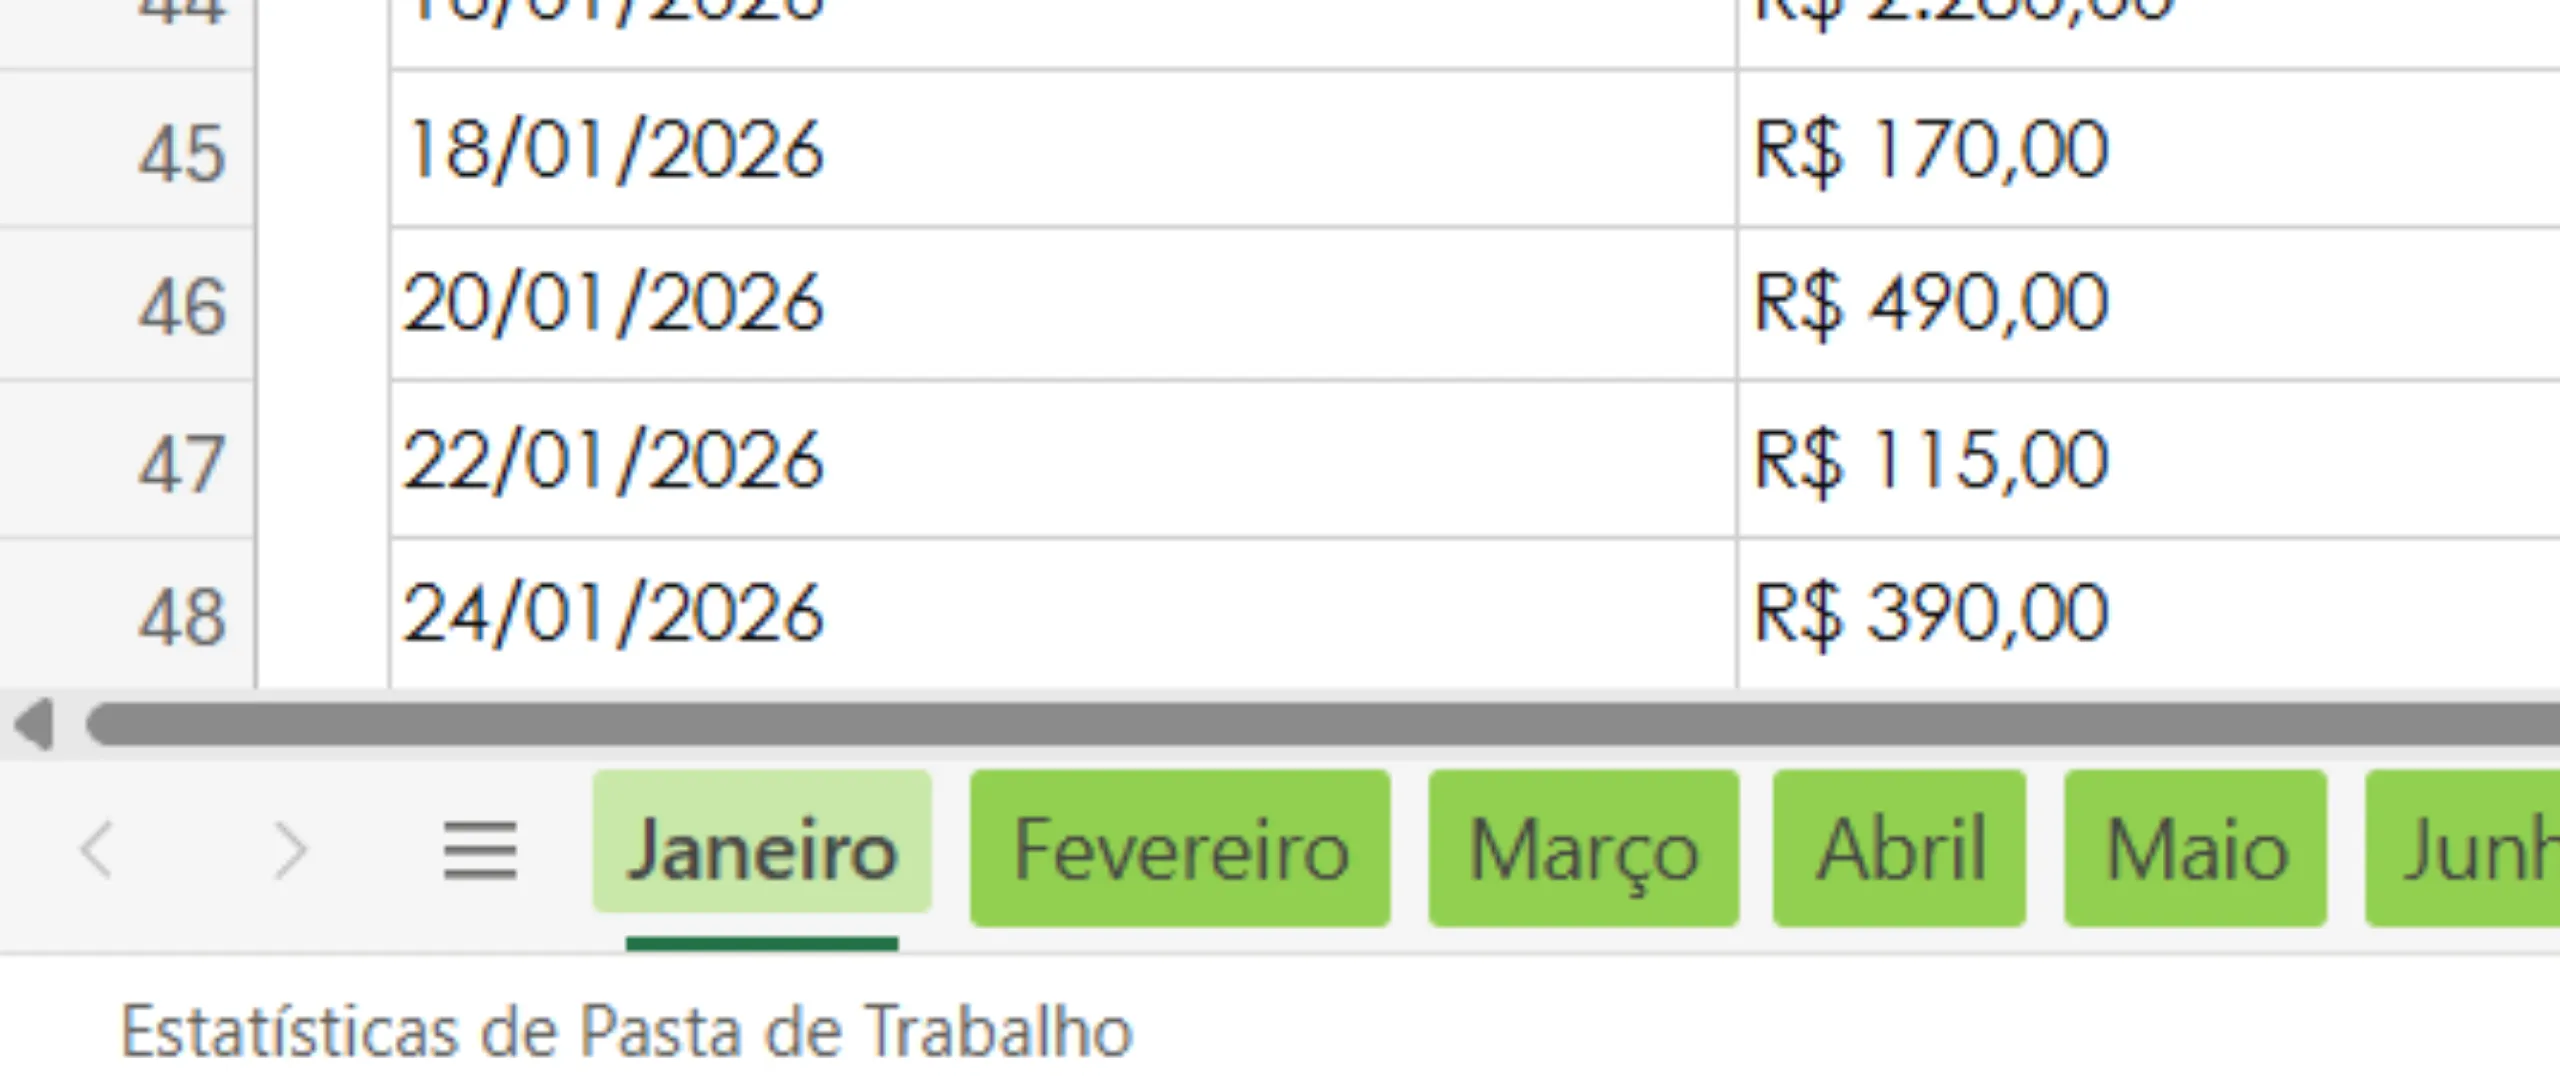
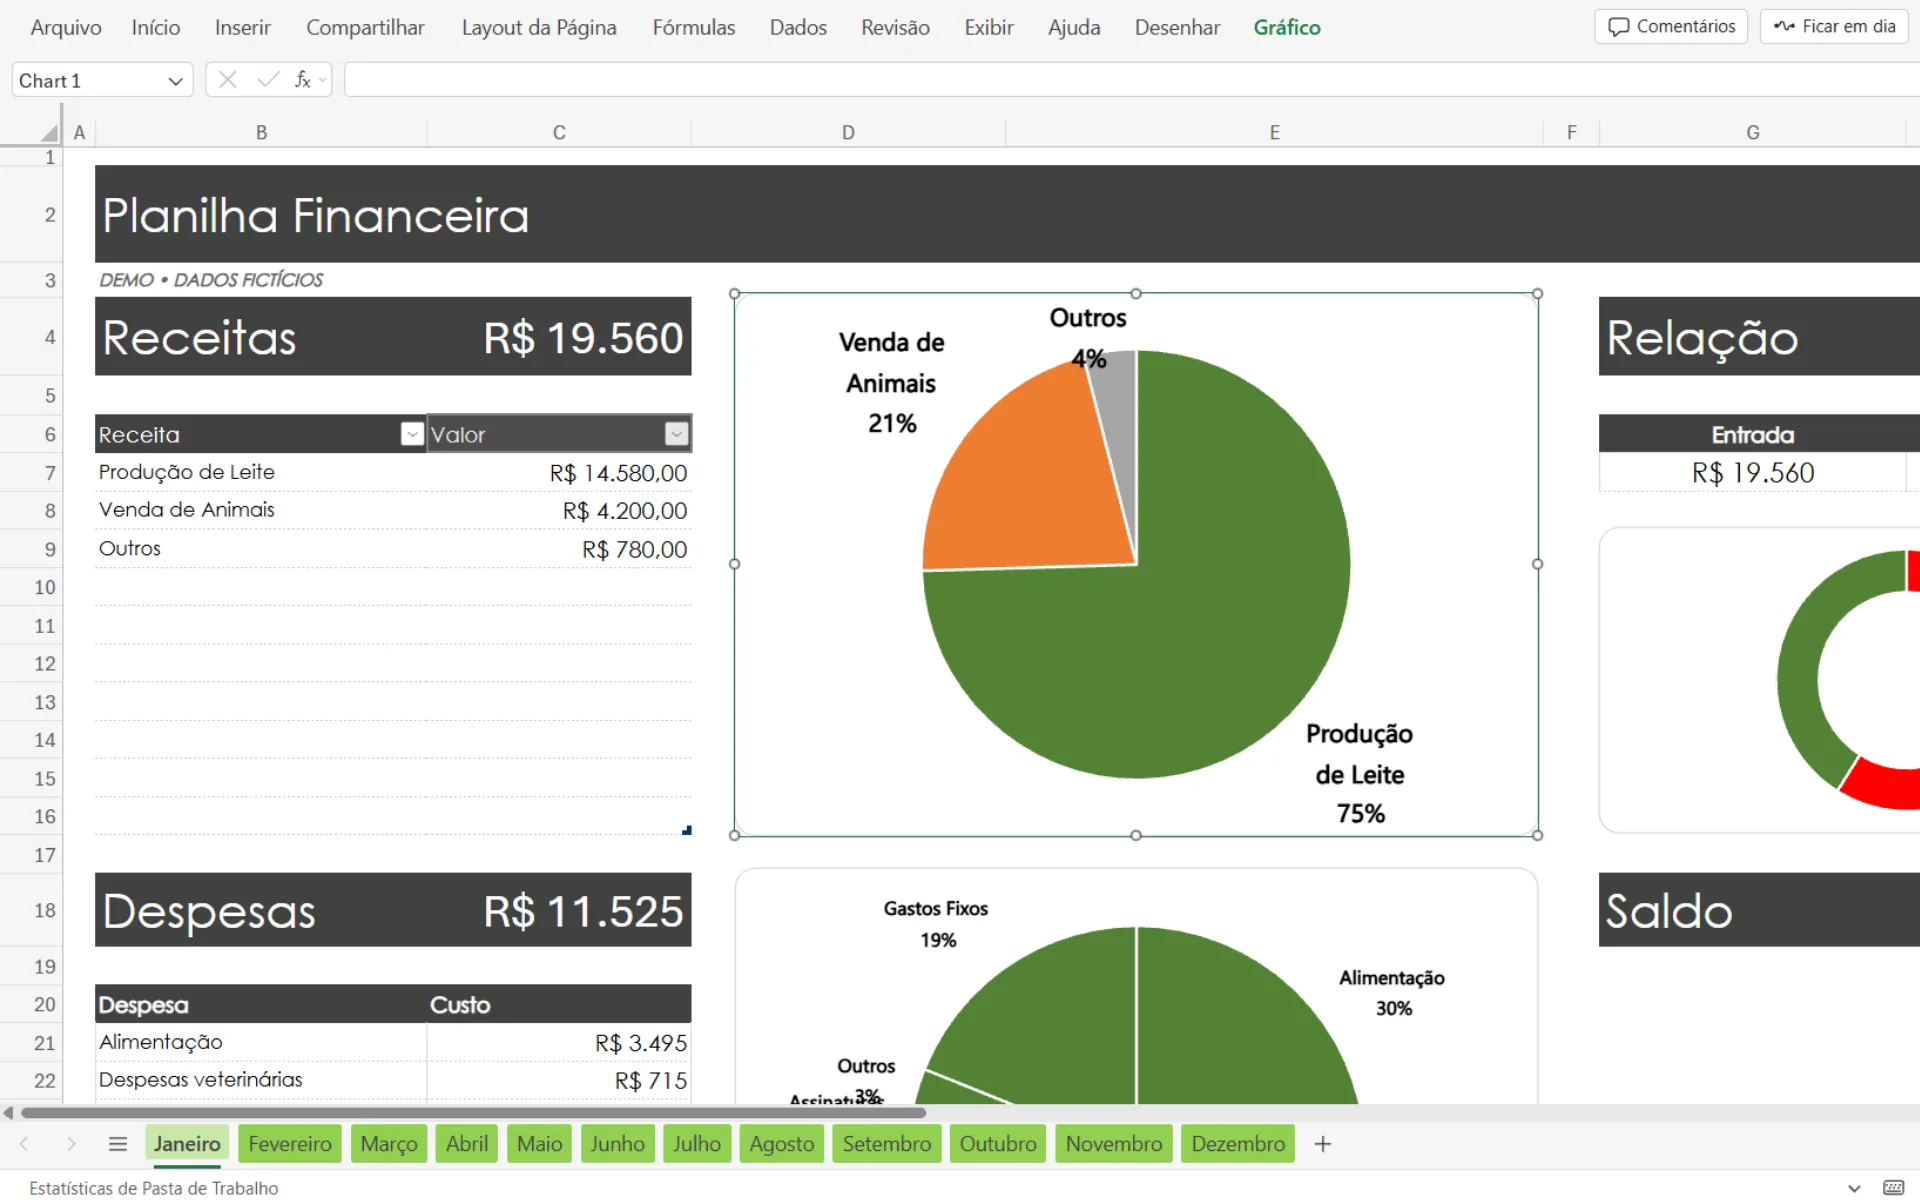
The spreadsheet is organized into 12 tabs, one for each month. Each one brings together income, expenses, fixed costs, balance, and visual indicators.
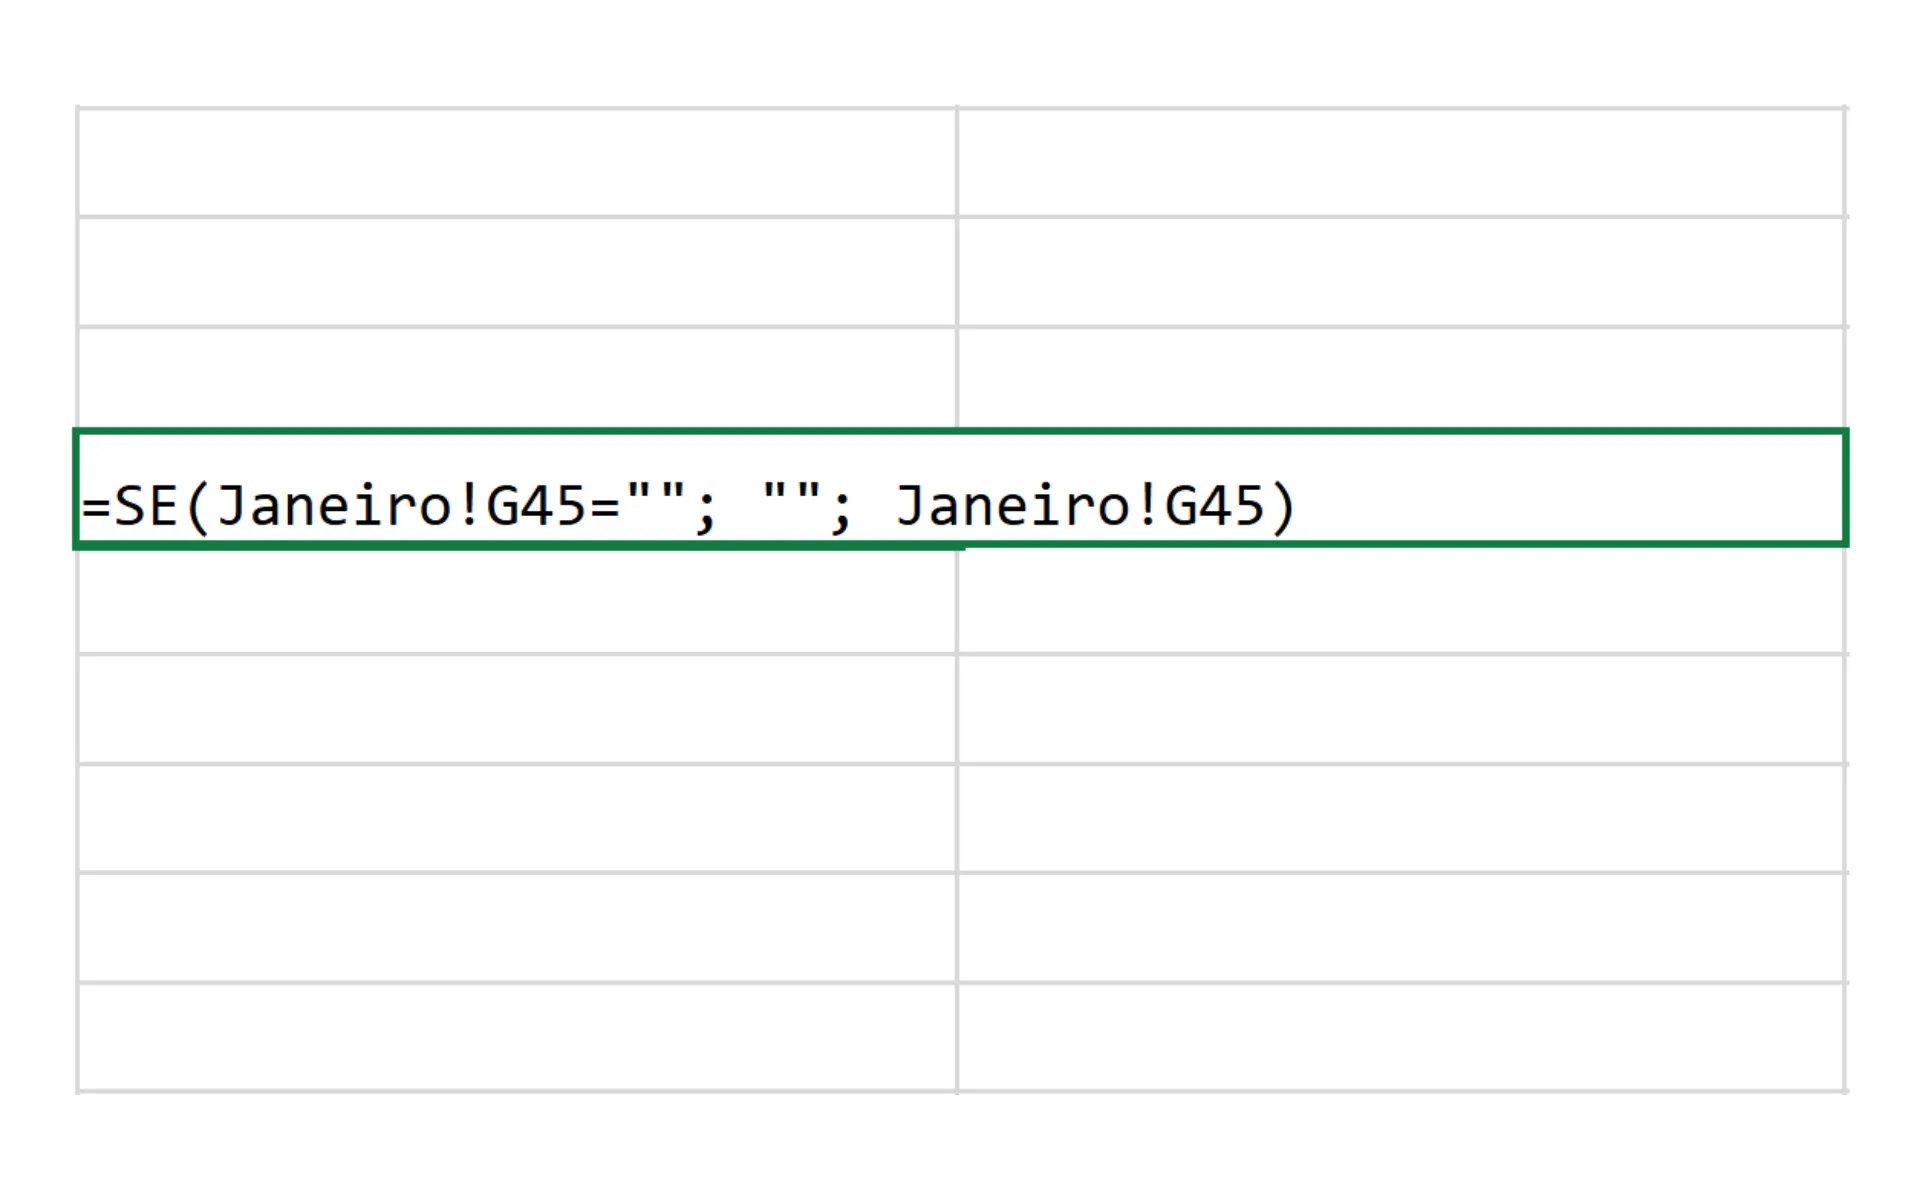
FORMULAS ACROSS TABS & CATEGORIES
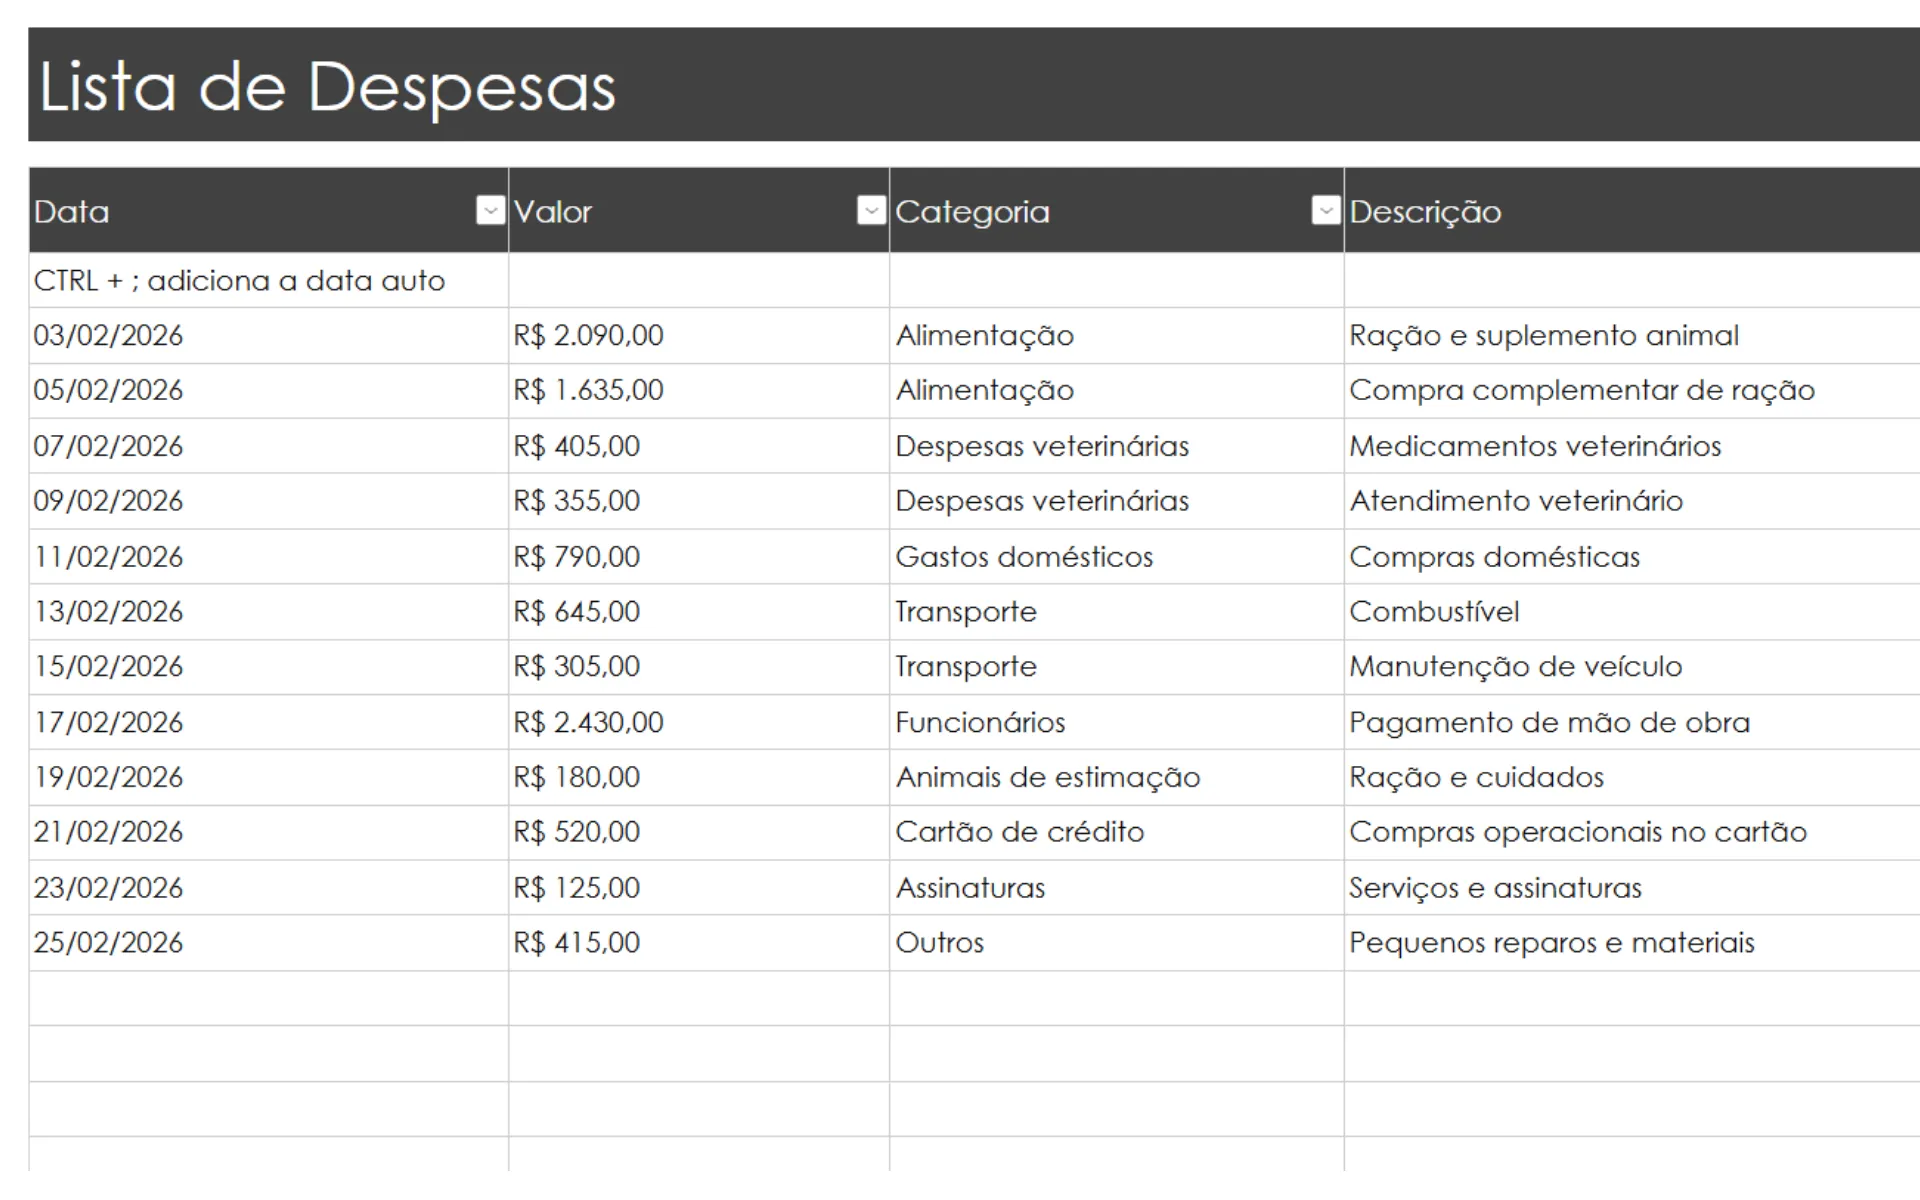
Formulas connect individual entries to monthly summaries, aggregate expenses by category, and reuse information across periods. This reduces manual calculations and keeps the data organized within the spreadsheet.
- SUM calculates overall totals, while SUMIF consolidates values by category.
- IF handles specific conditions, while FILTER returns only the required data.
- Cross-sheet references make it possible to reuse information and keep periods connected.
MONTHLY VIEW
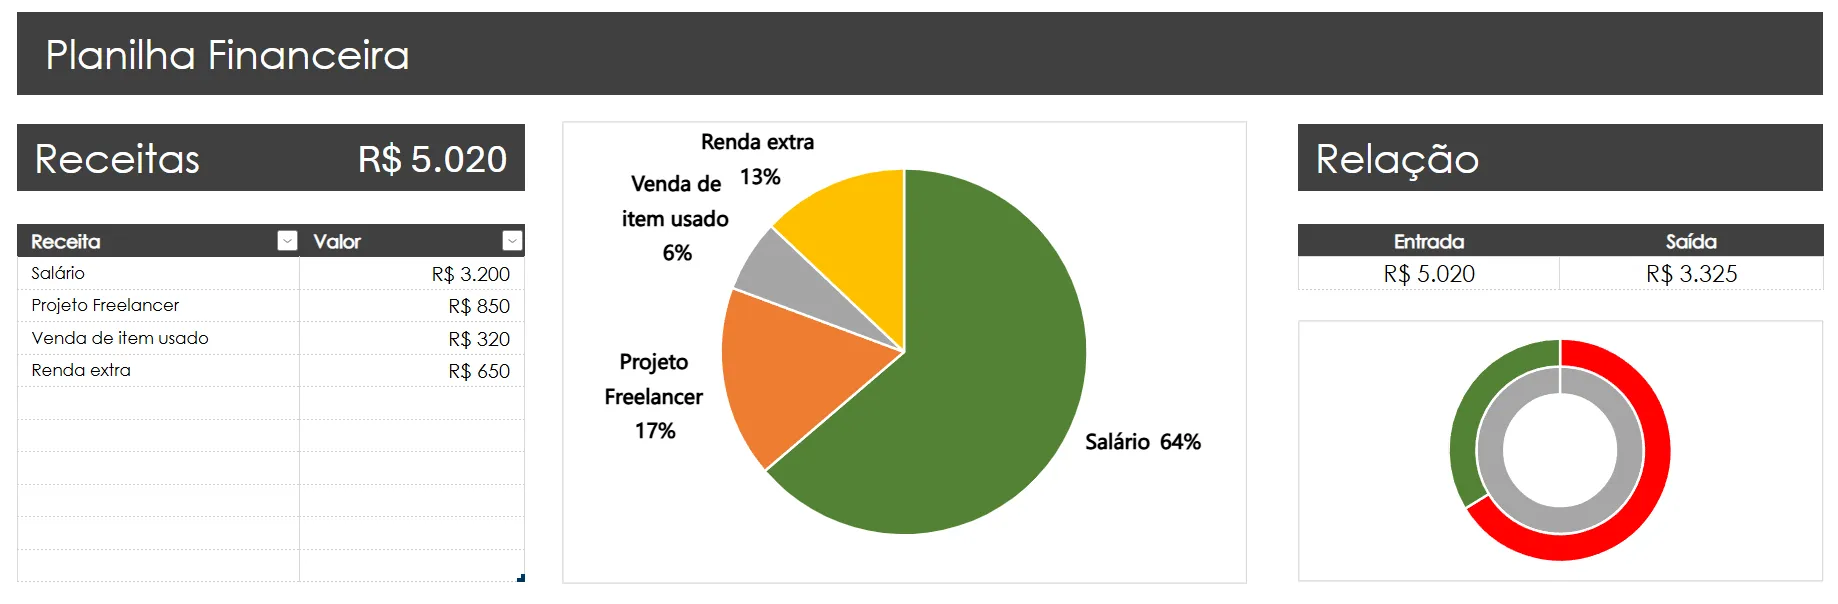
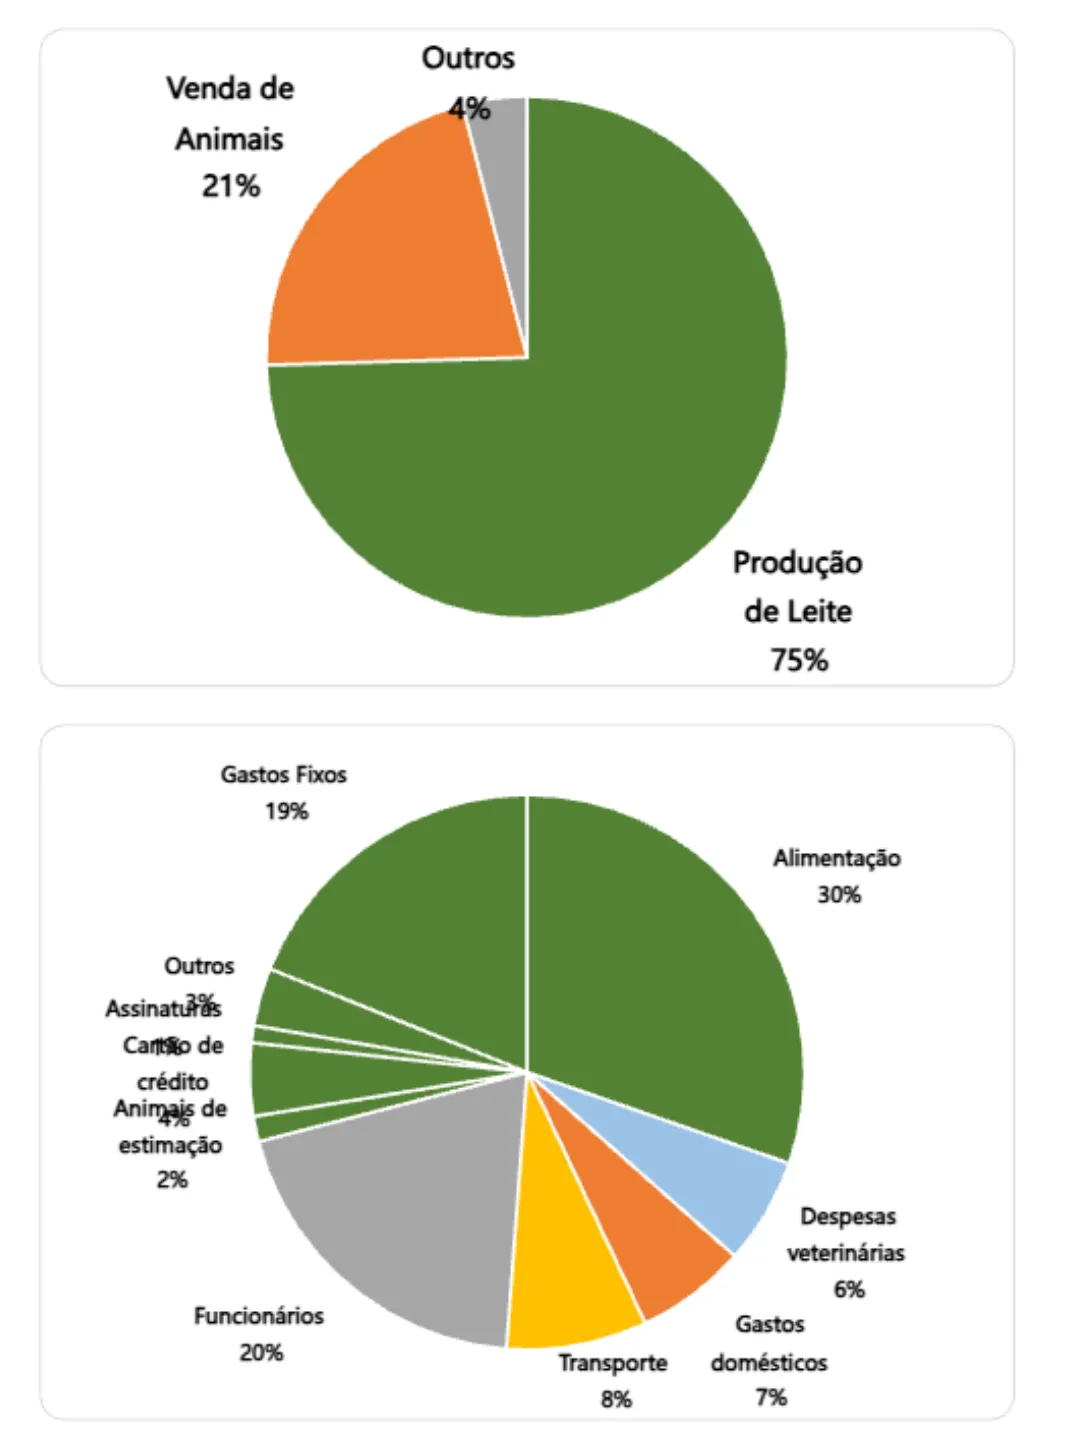
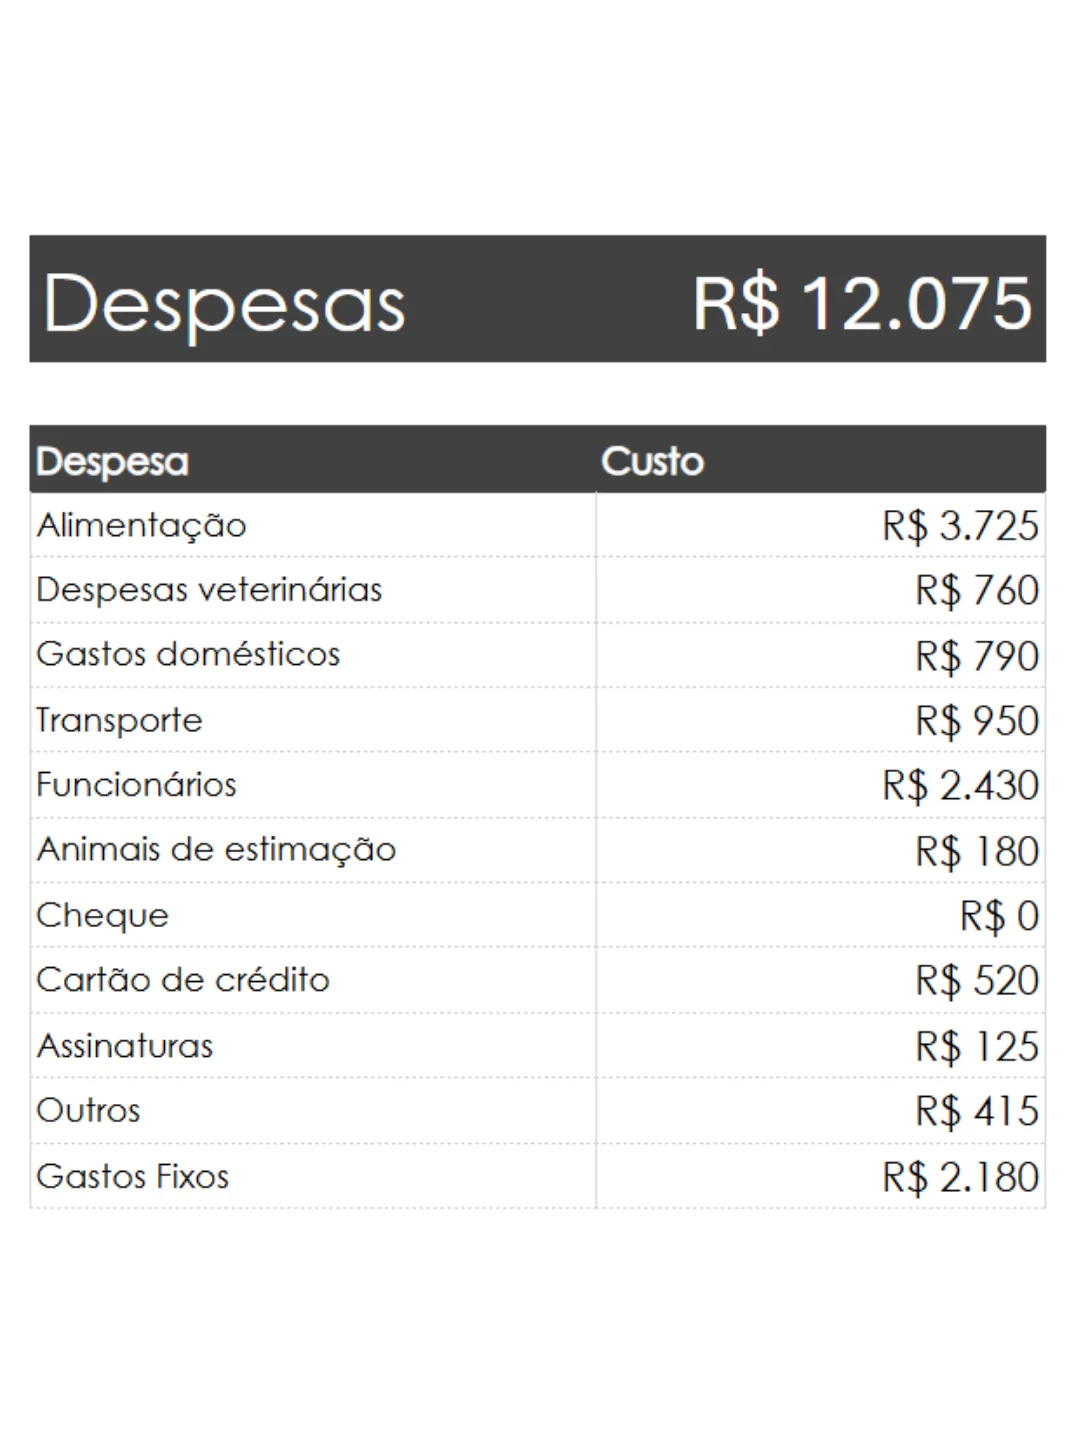
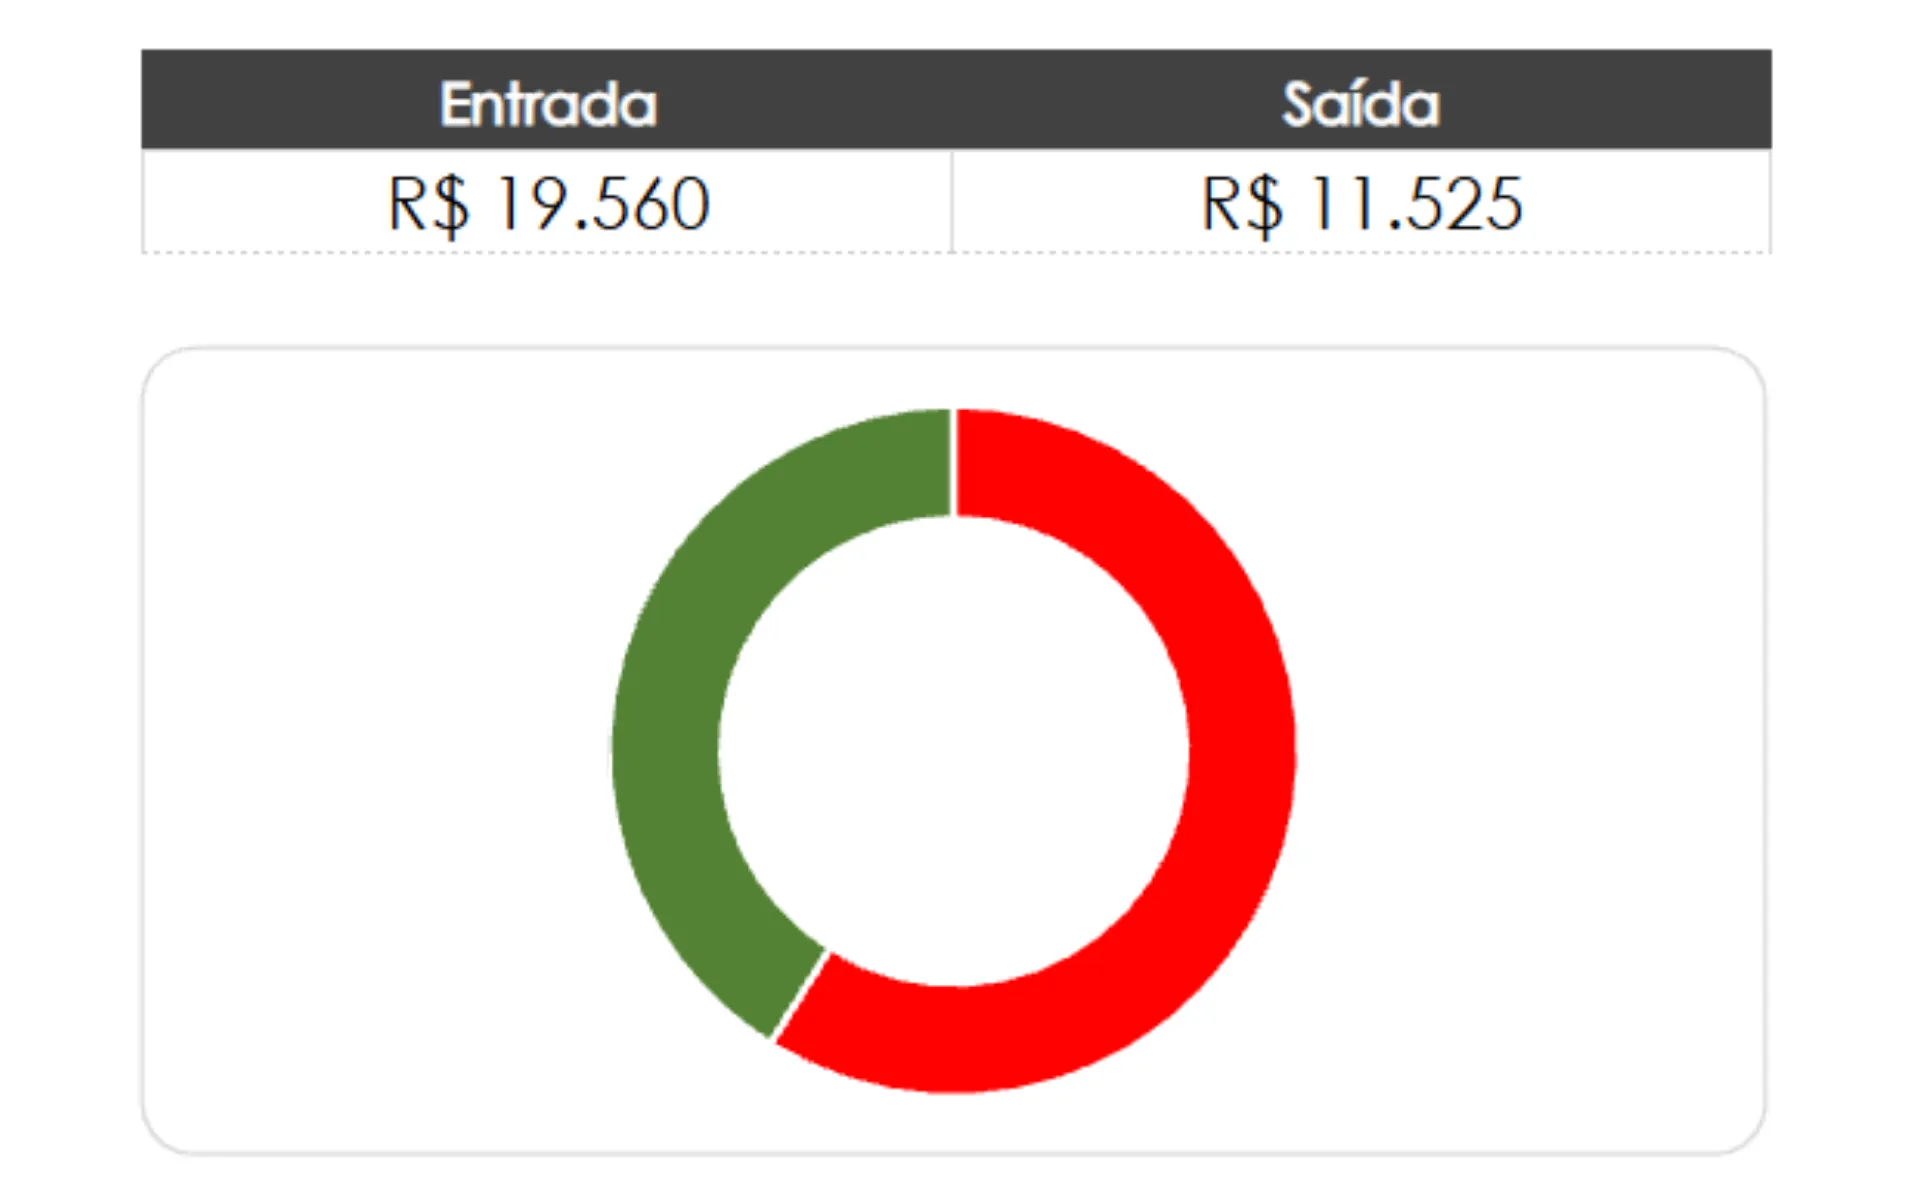
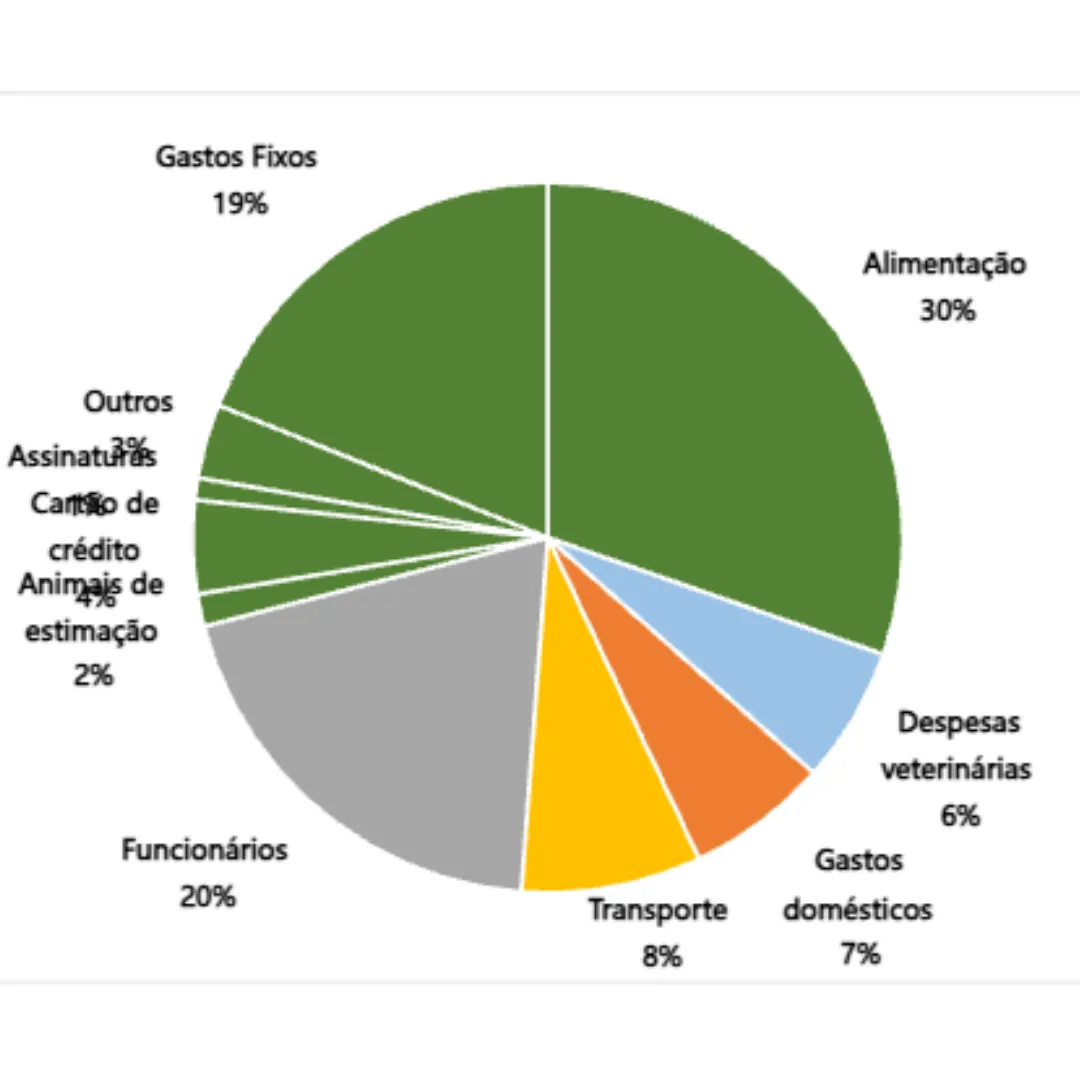
Each month's data automatically feeds totals, balance, and charts that help visualize spending distribution and the relationship between income and expenses.
- Total monthly income and expenses
- Automatically calculated balance
- Spending distribution by category
- Charts showing distribution and the relationship between income and expenses
FORMULAS IN PRACTICE
The project expanded my use of conditional formulas, cross-sheet references, and data organization, especially when building calculations based on specific categories.
SUMIF and FILTER simplified calculations and selections that would otherwise require manual checking.
Cross-sheet references required careful setup to keep each month's values connected correctly.
Organizing tabs and categories properly from the start made the spreadsheet easier to maintain.
Open the spreadsheet and explore its structure, formulas, and visualizations in action.
DOWNLOAD SPREADSHEET ↓Fictional data used exclusively for demonstration.- EXCEL
- SUM
- SUMIF
- IF
- FILTER
- TABLES
- CHARTS

OPEN TO NEWOPPORTUNITIES
If you'd like to discuss a role or project, feel free to get in touch.